03MESEA · high-speed line
Railway track temperature monitoring
Standalone rail-temperature measurement under live operating conditions, turned into real-time dashboards and alerts before thermal drift becomes a problem.
- EdgeRaspberry Pi nodes
- TransportMQTT
- Alertingthreshold rules
| Role | Edge hardware, data pipeline and supervision |
|---|---|
| Context | MESEA · high-speed line |
| Stack |
- 01Rail sensorstemperature
- 02Edge nodeRaspberry Pi · Python
- 03MQTT brokercentral
- 04Prometheusstorage · rules
- 05Grafanadashboards · alerts
Why it matters
Rail temperature is a key input for track maintenance: large swings put continuously welded rail under thermal stress. Maintenance teams need trends and thresholds, not occasional readings taken by hand.
Edge acquisition
- Raspberry Pi edge nodes with temperature sensors, installed and running on a live line.
- Measurements published over MQTT; collectors buffer locally and reconnect on their own when the link drops.
Supervision
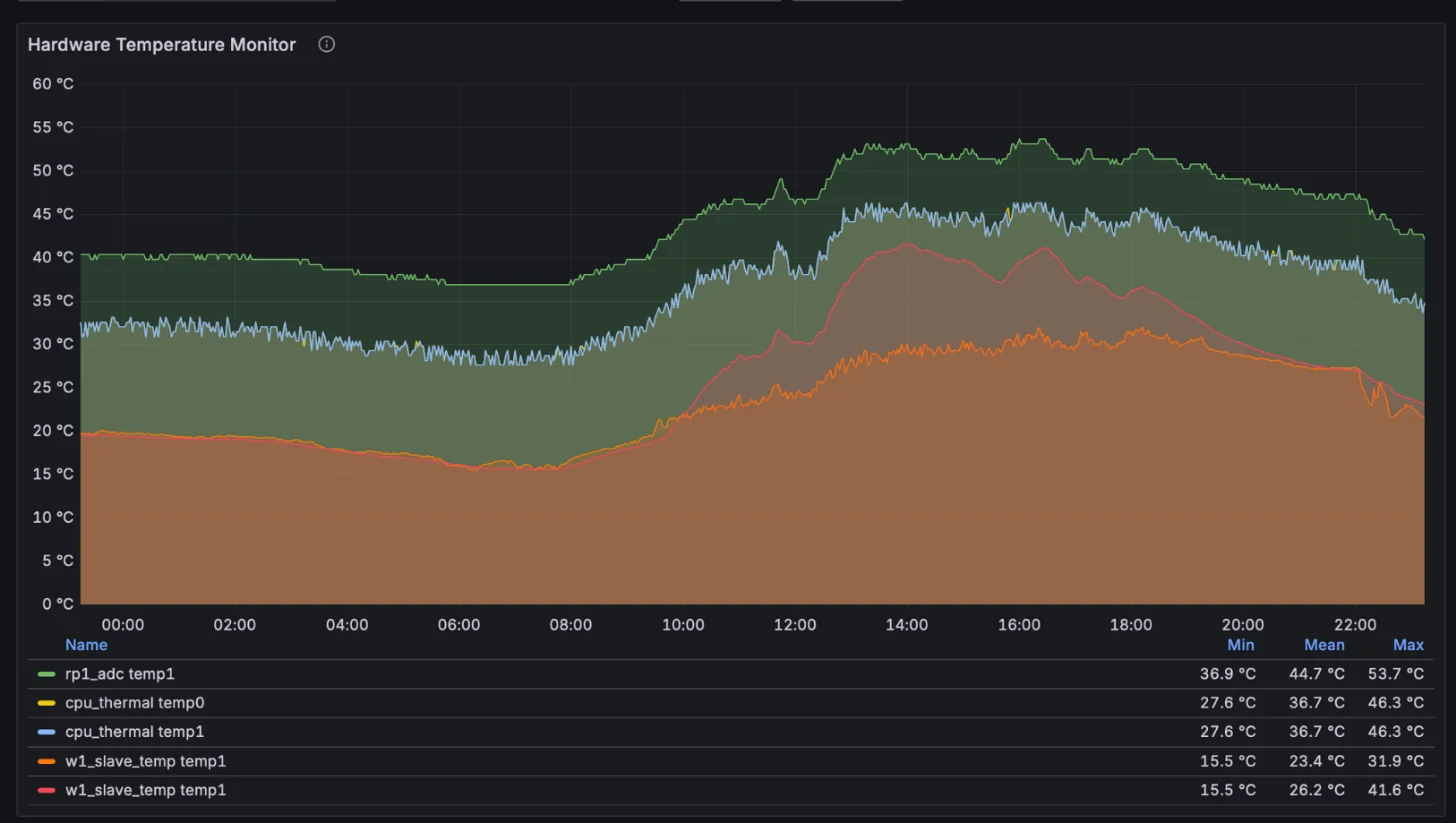
- Central broker feeding Prometheus, with Grafana dashboards for live values and trends.
- Threshold alerts for thermal drift instead of manual checks after the fact.
- The infrastructure itself is monitored too, so a silent sensor is noticed as quickly as a hot rail.
Supervision node
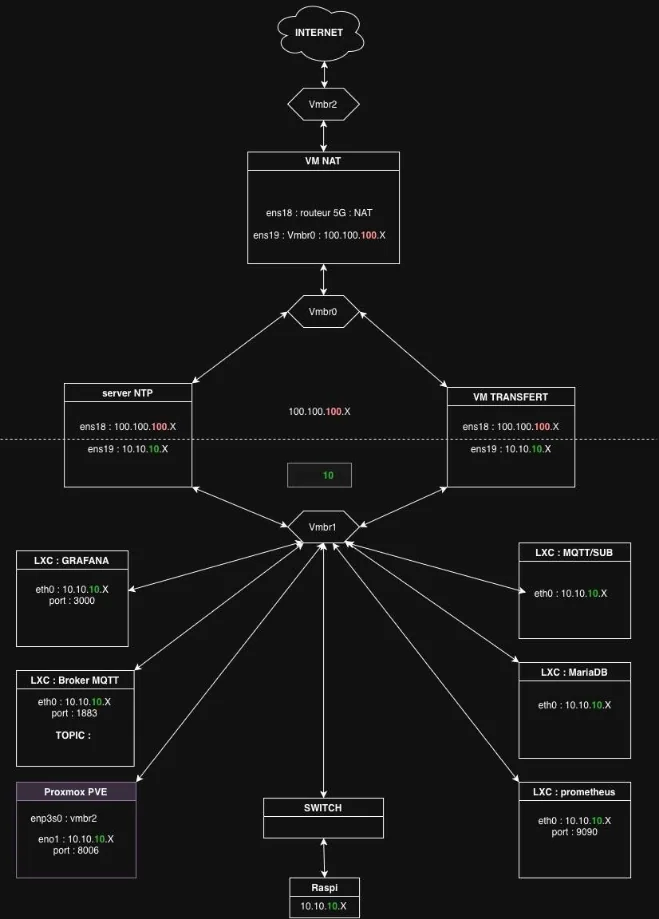
The whole chain runs on a dedicated Proxmox node: MQTT ingestion from a fleet of ten temperature sensors, measurements historised in MariaDB, Grafana for visualisation, and Prometheus with Node Exporter watching the node itself.
Network & security
- Dedicated, secured network: VLAN segmentation, firewall rules and VPN access.
- Supervision services virtualised on Proxmox rather than installed on the field hardware.
Delivery
Developed autonomously and end to end — from the Raspberry Pi prototype (Python, Shell) to the network and the virtualised services — and handed over with installation and operating files written to standardise IT / OT practice.
The result is a self-contained, documented system: reliable real-time tracking, with proactive alerting instead of manual checks after the fact.